How I Make Interactive Dashboards and Mini Apps in 15 minutes as an Accountant
I got a stomach bug EXACTLY when it was month-end. I was out two days hating life, then came back to a day and change of prep for our exec meeting. Instead of fluffing around with Excel, I built two working mini apps in Claude in 15 minutes. Here's how, and when to use them versus Excel.

I got a stomach bug EXACTLY when it was month-end. I was out two days hating life. When I got back to work I had a day and change to prepare for our exec meeting, where we'd promised flashy new "one-pager" graphs for each profit centre.
These weren't standard Excel charts. They were hybrid bar-line charts pulling from over five separate data sources, with P&L measures on a 3-month rolling aggregation. One was a dual bar-line where the bars showed accrued income and debtors (with the debtor bar broken by aging category), and the line was the accrued income to debtors gross profit ratio.
Instead of fluffing around with Excel, I built two working mini apps in Claude in 15 minutes. I uploaded my CSV and Excel files, got clean interactive charts, and exported them as PNGs for the presentation.
An example
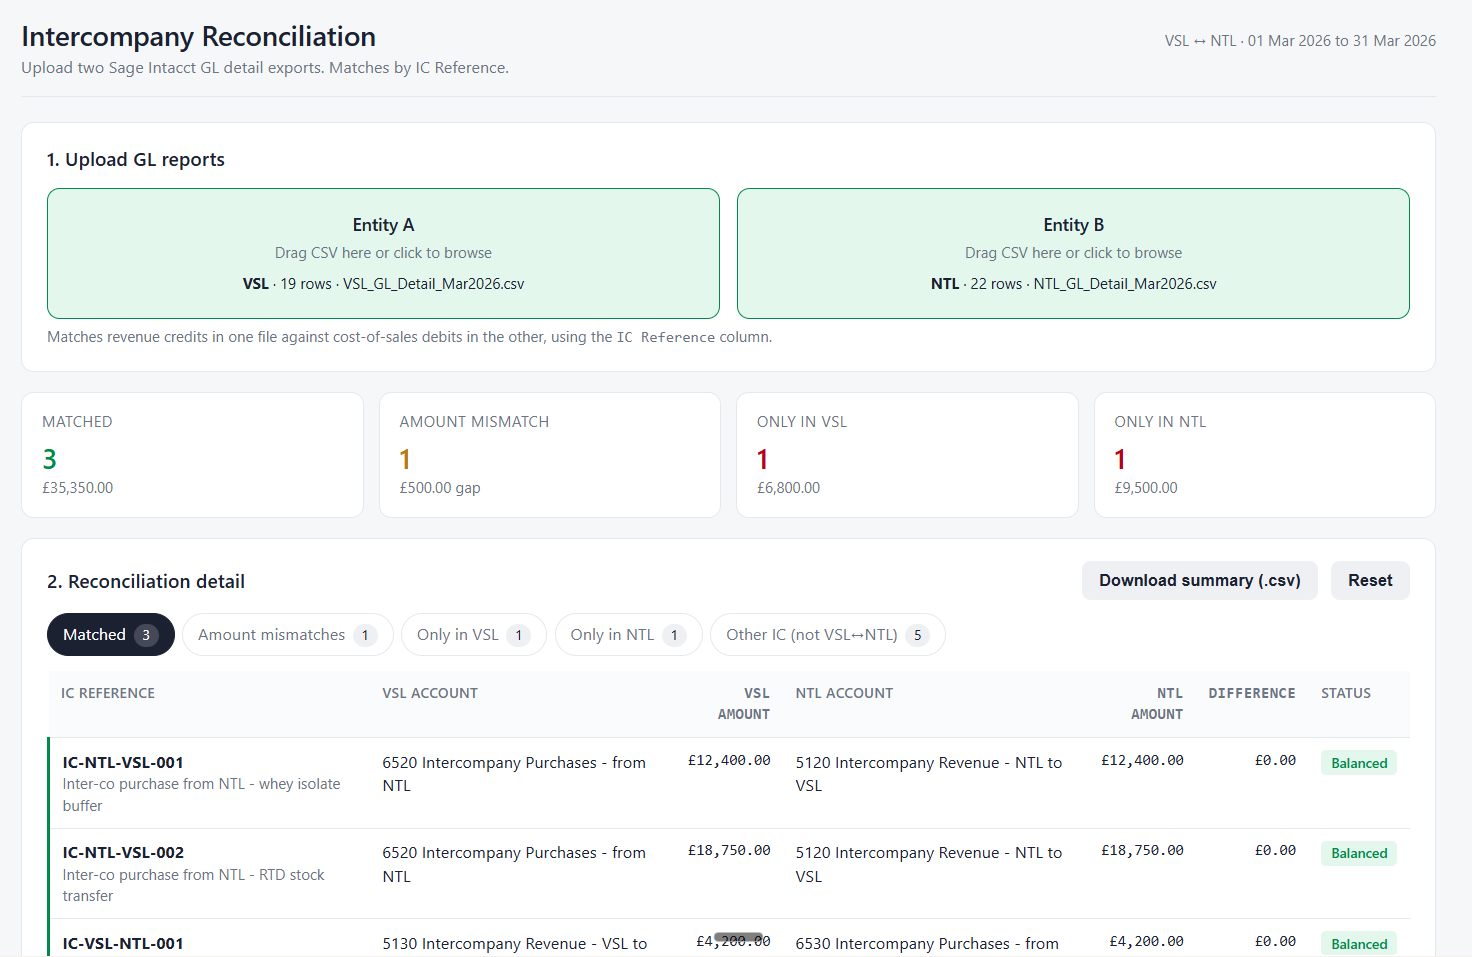
Rather than explain how this works, I wanted to show it. So I asked Claude to build a working demo on my fictitious company Thornbury Group (a UK maker of sports supplements): take two intercompany GL extracts, one for each group entity, and flag what matches, what doesn't, and where the amounts disagree. This is the kind of reconciliation finance teams grind through in Excel every month. I described what I wanted:
Create an HTML based intercompany reconciliation Claude artifact that lets you upload GL reports to perform the intercompany reconciliation.
A couple of minutes later I had a self-contained HTML app I could open in any browser. No install, no backend, nothing I had to code myself. Here's what it looks like:
What these things are
What I’m describing is referred to as a Claude Artifact but you can create similar mini apps in ChatGPT and Gemini using the Canvas feature. An artifact is a working app the model builds inside the chat. You describe what you want, it renders. You iterate by conversation.
Where I’ve actually used them
The mini app I described at the start was multi-purpose:
- It saved me time wrangling data from multiple sources into a structured format and experimenting with how to build the charts (and then formatting them. Getting the data labels right. If you know, you know.). I just upload the files into the app. If my source data changes, I upload the new file.
- Everything lives in one place, ready to export for the presentation.
- I can re-use it in future months.
- I can share it with management so they can play with the filters for an interactive view.
Another example. Our FP&A system has a report I download constantly that has far more columns and rows than I need. Some lines need grouping. Some signs need flipping. Doing that manually each time would drive me crazy, so I built a raw data converter tool artifact that applies transformation rules I specify and saves them for reuse. My workflow became: download, upload, click Transform, export the CSV in the format I want.
Everyone's work is different, so my specific use cases probably won't map to yours. That's the point. You can build something shaped exactly to your workflow.
A few more ideas:
- Management reporting and CFO dashboards based on key KPIs: upload the monthly P&L and Balance Sheet
- A variance explainer for monthly close conversations: upload meeting transcripts and P&L submission reports
- A prototype investor or lender reporting view before building it properly in Power BI or Tableau
- A Monte Carlo scenario calculator that projects outcomes based on probability distributions of revenue drivers
- An intercompany reconciliation tool: upload your intercompany reports
From October 2025, Claude artifacts support MCP integration, so you can connect tools like Gmail, Hubspot, and Quickbooks directly into the apps you build. I haven't played with this much but will write it up when I do.
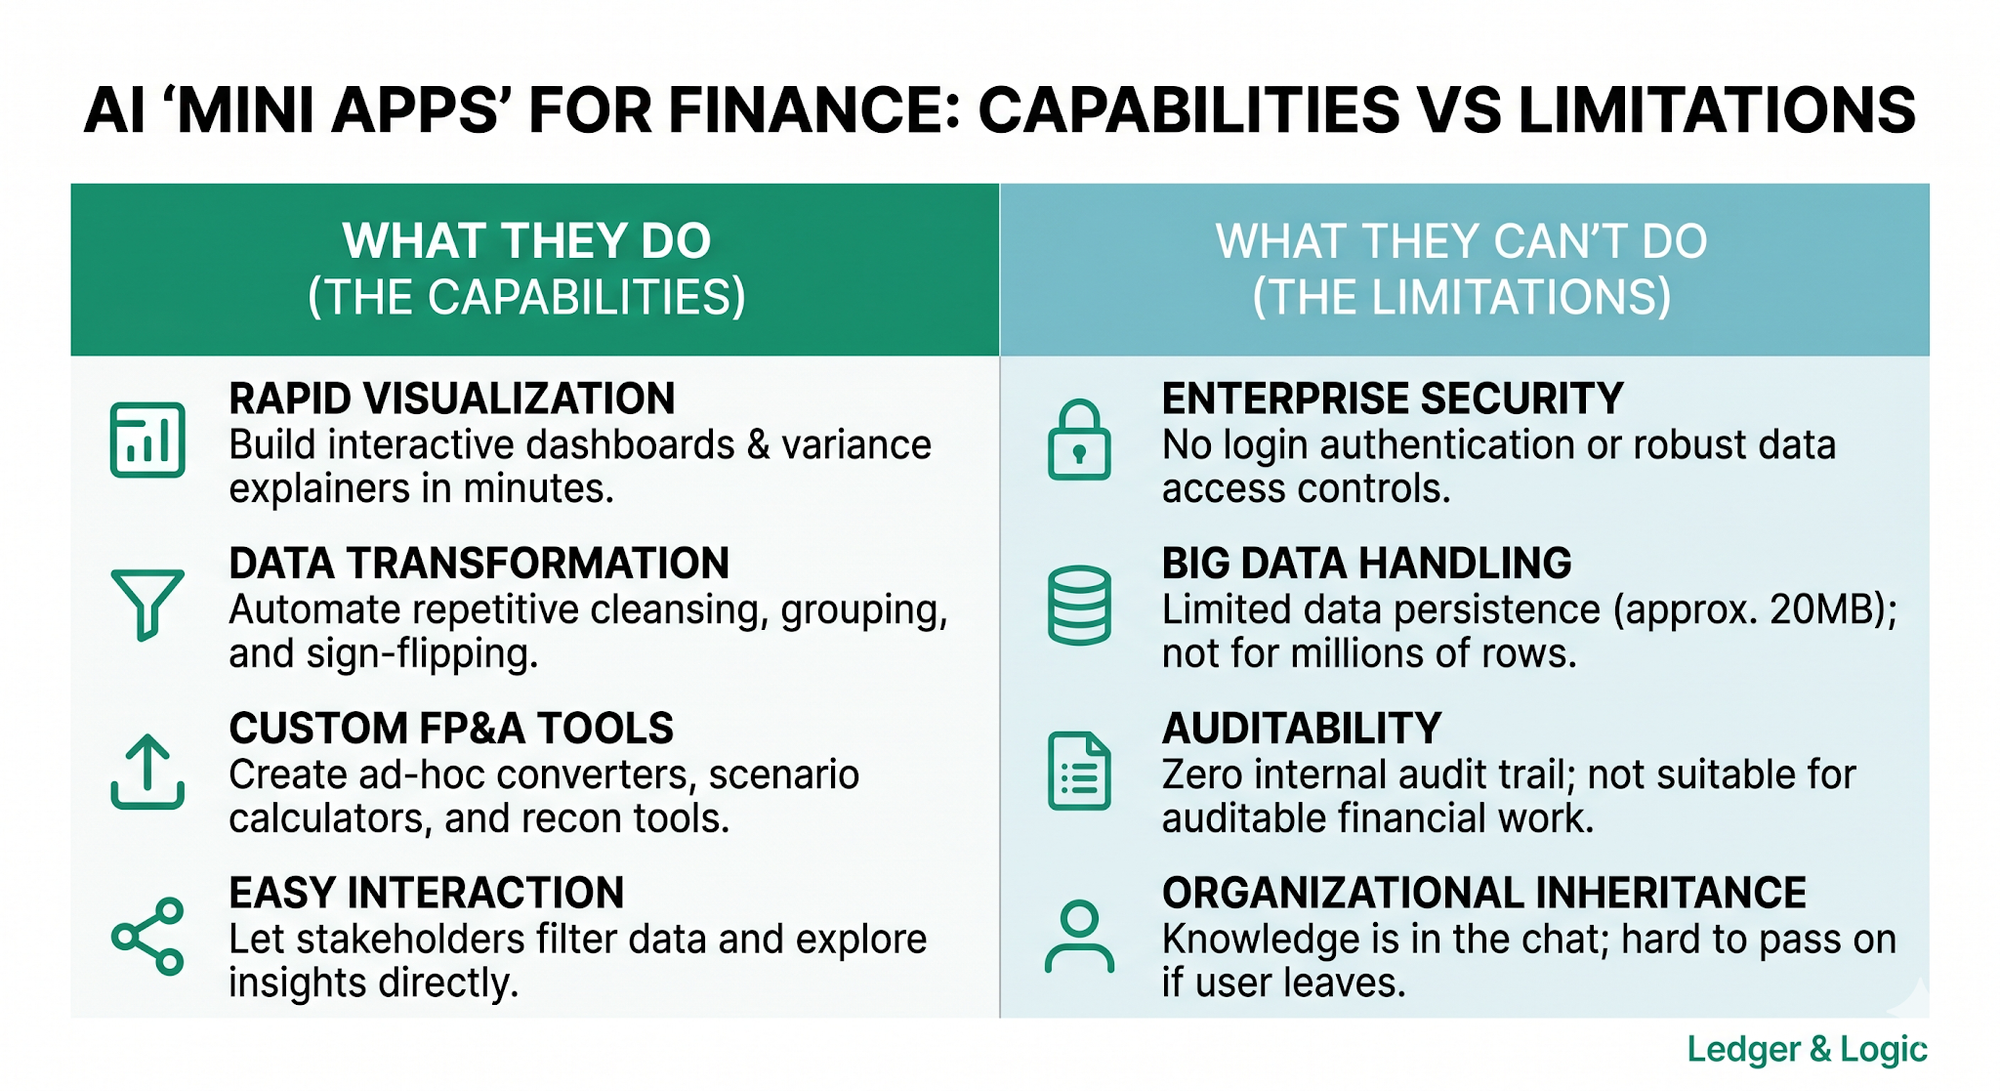
The limitations, real talk
Artifacts let anyone turn a mini-app idea into something working, but they're not a replacement for Power BI, Power Apps, or Power Automate.
First, there's no production-grade authentication. No login security or row-level access controls like you get with enterprise apps. On the Claude Enterprise plan you can share artifacts inside your organisation, but there's nothing beyond that.
Second, artifacts currently have persistent memory of around 20MB and live in Claude's sandbox environment rather than the cloud. They aren't meant to be databases like Snowflake, or to handle million-row CSVs like Power BI.
Third, there's no audit trail. Don't use these for work that will be audited. There's also a succession risk: if I leave my organisation, the colleague who inherits the artifact won't know much, even with my chat history. As best practice, I've started writing product specification briefs for every artifact I build, and storing the source data in our SharePoint.
A decision framework
So how do you decide when to build an artifact versus using Excel or an enterprise tool like Power BI?
Answer these questions for whatever you're trying to do:
- Who's the audience? Me, my team, an exec, external?
- How easy is this to do the traditional way?
- How long would it take the traditional way?
- How important is it that someone can pick this up tomorrow if I'm not there?
- Will this eventually be under auditor scrutiny?
Two examples. One, I want to build an intercompany reconciliation tool for my team. Two, I need to build a sensitivity model to send to our investors.
Try one before you open Excel
Artifacts are a powerful addition alongside Excel and your enterprise apps. They close the gap between "I wish this existed" and "someone builds it."
So for the next ad-hoc request that lands in your inbox, try building an artifact before you open Excel. See what happens.
Timon